")


Let’s climb into the Way-Back machine.
First stop – September 1974. What were the then news headlines? There were many, but probably the most impactful one was the resignation of Richard Nixon as part of the Watergate scandal fallout. That entire event, which played out over nearly two years on national television created a constitutional crisis which some believed threatened the very existence of our republic.
After the stock market peaked in early 1973, a portfolio represented by the U.S. total stock market1 proceeded to decline by nearly 50% over the next two years. Arghh. Not fun. No good news anywhere. The end was nigh.
Second stop – The Fall of 1987. For a myriad of reasons – and for no particular reason – stocks began a vicious tailspin that culminated in what is now called the Crash of ’87. The market portfolio during that period fell nearly 30%. Again, no particular reason or catalyst for the fall. It just happened.
Total Stock Market Index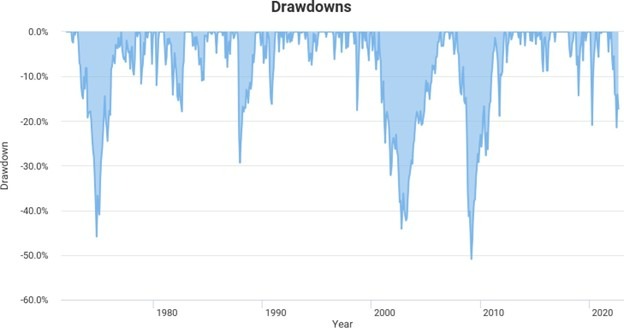
Source: www.portfoliovisualizer.com
Third Stop – The Technology Crash of 2000 – 2002. Pets.com anyone? While the more speculative areas of the market were down 60% – 80%, a U.S. total stock market portfolio declined by 44% during that two-year period.
Fourth Stop – The Financial Crisis of 2008. I suspect most of you might remember that period as it was not that long ago. Concurrent with the fact that the financial system of the entire world came close to literally collapsing, a U.S. total stock market portfolio declined by 51%. In real time, that period was really scary. If you weren’t scared, you didn’t understand what was going on.
****************************************
Actually, all of those periods in real time were scary. No one knew how things would play out (no one ever does). But somehow, they did.
Which brings us to today.
We’ve got inflation problems, geopolitical instability, political rancor not seen since the late 1960’s, and (…insert your problem here). And unsurprisingly, all of these current troubles are being expressed in current market returns, as a market portfolio finds itself down by roughly 17% measuring from the beginning of the year.
With this background, take a look at the chart below. It represents the growth of $10,000 invested in the U.S. total stock market. In spite of the trouble and turmoil of the last fifty years, that $10,000 is now worth nearly $1,500,000.
Portfolio Growth
Total Stock Market Index
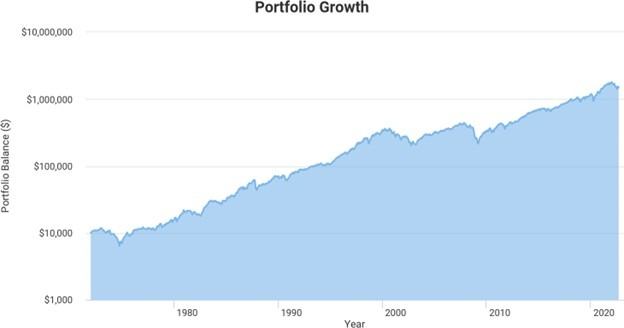
Source: www.portfoliovisualizer.com
What did it take to realize this outcome?
You would have had to ignore everything. You could not have let yourself get caught up in the fear headlines of the day. Fear headlines that have ALWAYS been there. They never leave. They just shape-shift in a batch of new words to fit the day. They’re wicked. As far as your investments go, turn them off.
Look back on past declines of 1974, 1987, 2000, 2008. When viewed retrospectively, they weren’t disasters, they were opportunities.
I believe that it is likely that this current period of troubles might well be viewed similarly in the future. I don’t know when this current period of trouble will end. No one does. But, I do believe it will. And when it does, I look forward to another period where we can look back and say, what an opportunity.
1 – The Dow Jones U.S. Total Market Index (DWCF) is a market-capitalization-weighted index Dow Jones Indexes maintains that provides broad-based coverage of the U.S. stock market. The Dow Jones U.S. Market Index, considered a total market index, represents the top 95% of the U.S. stock market based on market capitalization.