")


Yes, stocks can drop. Sometimes a lot. That’s not exactly news, nor should it be long-term consequential. How we react to those times of stock market duress, however, is very consequential.
The chart below from JP Morgan’s Guide to the Markets shows the annual returns for the S&P 500 in grey and the intra-year pullbacks in red.
Since 1980, the S&P 500 has seen average intra-year pullbacks of 14%. Yet, the market still ended positively in 33 out of the 44 years considered, with a recovery soon following the down years. The only multi-year period in which the markets’ returns were in the red occurred from 2000 – 2002, a result of the dot.com era bubble crash. And even then, patient and disciplined investors were soon rewarded.
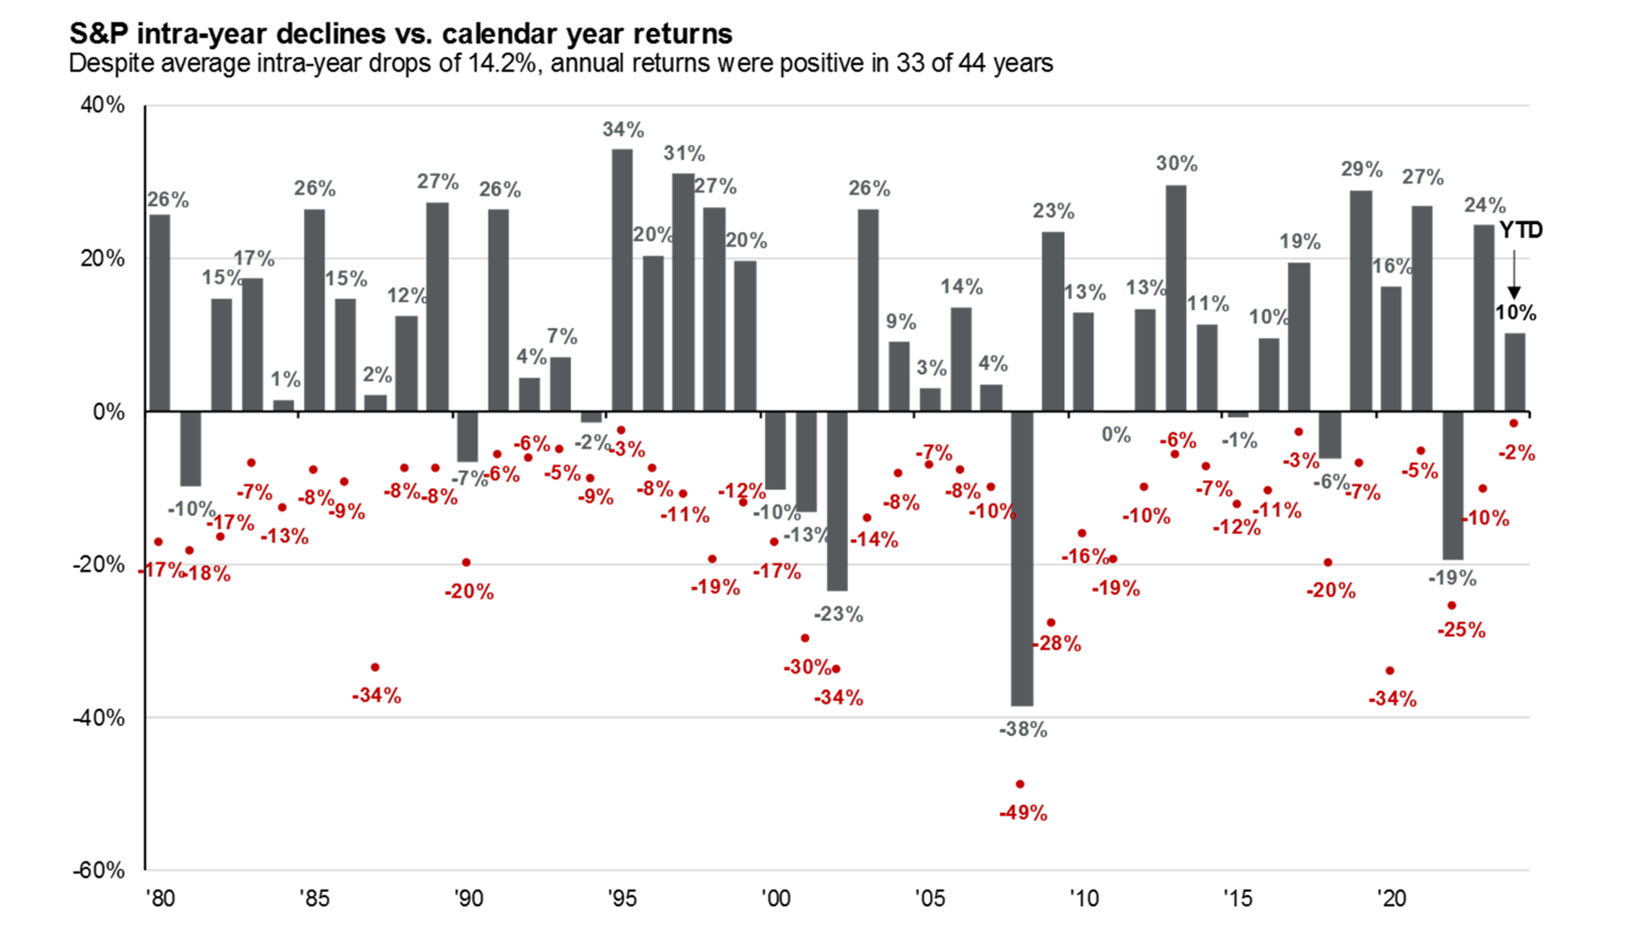
Red dots show intra-year stock market drops. Grey bars show full calendar-year results.
(J.P. Morgan Asset Management, 2024)
*************************************
For many years now, I have been cataloging the biggest worries of the year, starting back in 1972. I’ve also cataloged how the indexes used to build a balanced portfolio performed over that same period of time, troubles not-withstanding. Here’s the updated list, through 2023.
History Revisited
52 Reasons Why People Got Scared Out of Their Investment Plan.
- 1972 Dow Tops 1000 – Market too high
- 1973 OPEC Oil Embargo
- 1974 Watergate, Impeachment, Nixon Resigns
- 1975 Deep Recession in Progress
- 1976 Limits to Long-Term Growth
- 1977 Inflation Increases
- 1978 Interest Rates Rise Dramatically
- 1979 Iranian Revolution – Oil Prices Soar
- 1980 Interest Rates and Inflation Soar
- 1981 Deep Recession Begins
- 1982 Recession Worsens
- 1983 Market Prices too high
- 1984 Record Federal Deficits
- 1985 Economic Growth Slows
- 1986 Dow Nears 2000 – Market too high
- 1987 Black Monday – Market Crashes 20% in One Day
- 1988 Savings and Loan Crisis
- 1989 Bank Failures Increase
- 1990 First Persian Gulf War
- 1991 Dow Tops 3000 – Market too high
- 1992 Global Recession
- 1993 Hillary Clinton’s Health Care Reform
- 1994 Mexican Currency Devaluation
- 1995 S&P 500 tops 629 – Market too high
- 1996 Greenspan warns of “Irrational Exuberance”
- 1997 Asian Financial Crisis
- 1998 Russian Currency Devaluation
- 1999 Presidential Impeachment
- 2000 Technology & Dotcom Meltdown
- 2001 9-11 Terrorist Attacks
- 2002 Corporate Malfeasance – Enron & WorldCom
- 2003 2nd War in Iraq, SARS virus
- 2004 Decline of Dollar
- 2005 Hurricane Katrina
- 2006 Rising Gas Prices
- 2007 Subprime Mortgage Crisis
- 2008 Credit Collapse and Great Recession
- 2009 Collapse of Major U.S. Financial Institutions
- 2010 European Debt Crisis – Greece
- 2011 Downgrade of U.S. Debt
- 2012 Extreme Political Polarization in U.S.
- 2013 Mideast Turmoil and Wars Escalate
- 2014 ISIS Terror Escalates – Ebola virus
- 2015 Oil Prices Collapse – Isis Strengthens
- 2016 Extreme Political Election Acrimony
- 2017 Dow nears 25,000 – Market too high
- 2018 Rising Rates, Trade Wars, Political Disfunction
- 2019 Presidential Impeachment, Slowing Global Growth
- 2020 Coronavirus Pandemic – Polarized Electorate
- 2021 Inflation Increasing rapidly
- 2022 Russia Invades Ukraine
- 2023 Hamas and Iran attack Israel triggering Mideast war
And in spite of all of that, 1 Good Reason Not to Abandon Your Investment Plan
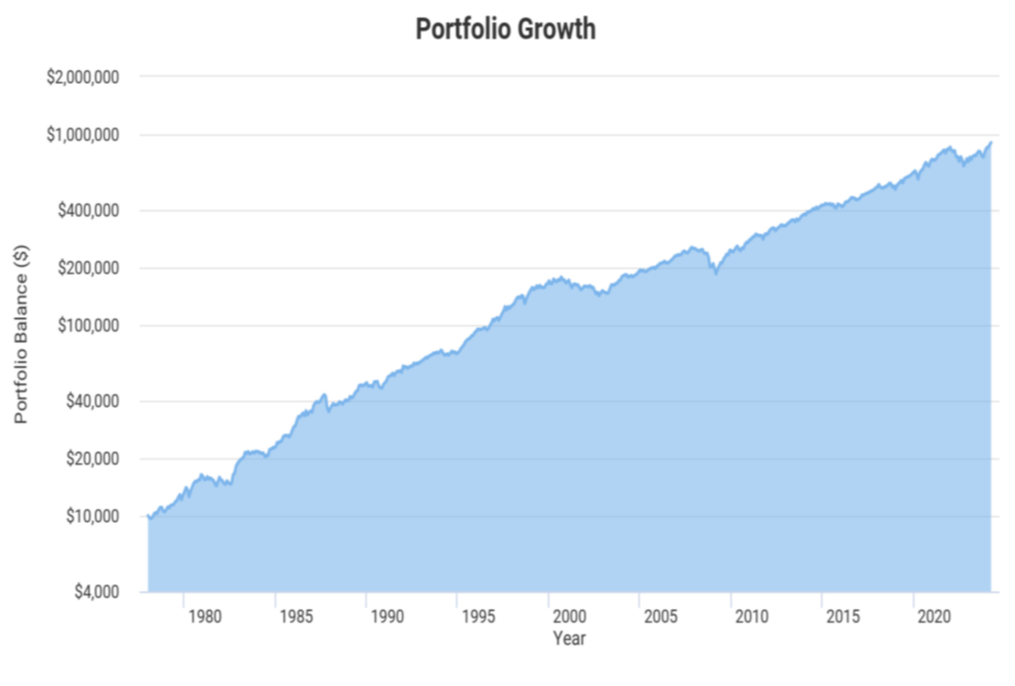
Balanced Index Allocation, 60% US Stocks (Total Market), 20% Intermediate Term U.S. Govt. Bonds, 10% Long-Term U.S. Govt Bonds, 10% Gold, rebalanced annually. This is not a portfolio; it is the outcome of the underlying indexes, used in the percentages shown. You cannot invest directly in an index. Past performance of indexes represented may not reflect future results. Results generated by Portfolio Visualizer.
Look again at the above chart. That diversified allocation (stocks, long and intermediate term-bonds, gold) has taken everything the world could throw at it over the last 52 years. And yes, while there have been periods of portfolio duress, the final outcome is inarguable. As Warren Buffet has stated,
” In the 20th century, the United States endured two world wars and other traumatic and expensive military conflicts; the Depression; a dozen or so recessions and financial panics; oil shocks; a flu epidemic; and the resignation of a disgraced president. Yet the Dow rose from 66 to 11,497.”
The above chart, along with Buffett’s observation, might help to maintain perspective when the going gets rough.
Here at BCM, we design our portfolio structures with an All-Weather viewpoint in mind. Our Balanced portfolio emulates this philosophy with the asset classes illustrated in the above chart and can be illustrated by using the analogy of a stool with four legs.
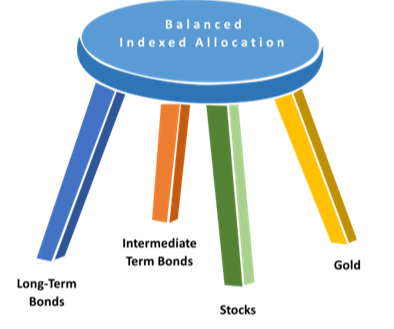
Now, here’s the trick. For this portfolio structure to “work”, you have to let it do so. You need to give it time. And, as with any stool, it needs to stand on all four legs.
Whatever leg(s) may be penalizing total portfolio performance today, the design is such that the other legs should take up the slack. And since the efficacy of the legs changes throughout the economic cycle, trying to micromanage the allocation, or even pay attention to what any individual leg is doing today is not productive. In fact, doing so is more likely to penalize you than not.
So, unless you have privileged information regarding the future, maintain your discipline and leave your portfolio alone. Just let it work for you. It will do the financial heavy lifting for you just fine, on its own.
*************************************
Don’t forget Pascal’s quote on the state of man –
“All of humanity’s problems stem from man’s inability to sit quietly in a room alone.”
Blaise Pascal